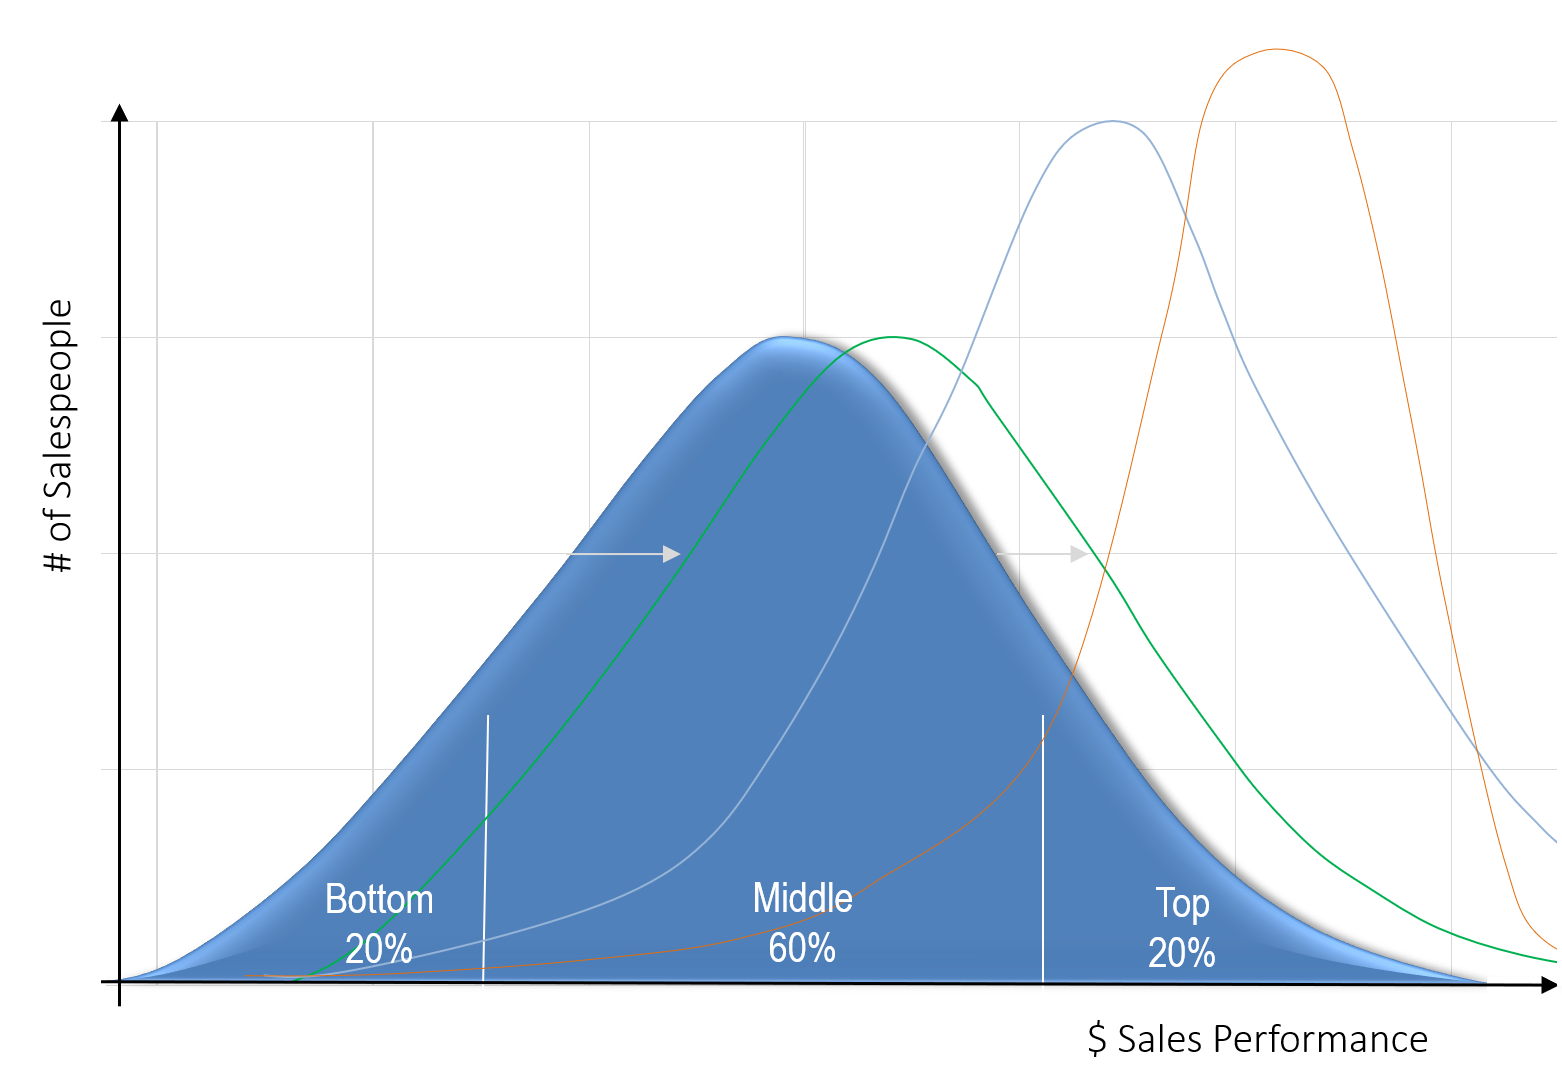
A 5% shift in sales performance by the middle 60% of salespeople yields over 70% more revenue when compared to a 5% shift in performance of high performance. (Source: Sales Executive Council)
An average team is comprised of bottom or underperformers (approx. 20%), middle performers (approx. 60%), and top performers (approx. 20%). Typically, the bottom 20% are there due to job-fit or motivational issues, and addressing their performance is a separate process. The top 20% are already outperforming their peers and pressing them for additional revenue or performance is generally not beneficial to an organization. The group with the most to gain and provide the greatest impact on your organizational performance, top and bottom line, is the middle 60% of your sales team – your average performers. Imagine the improvement in sales if just 5% of your team started moving to higher performance.
Whom To Move
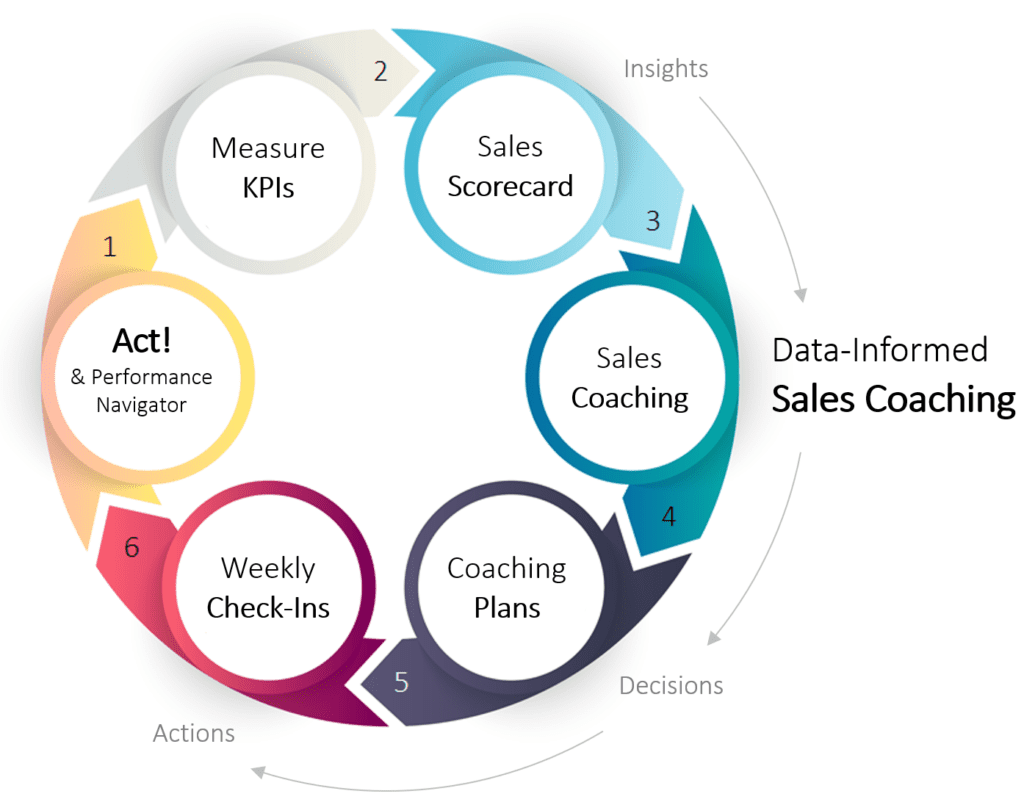
In the past, sales managers and leaders could only use sales bookings and quota attainment to measure how well their teams were performing. This didn’t provide insights into how specific salespeople (the top 20%) were able to drive more revenue. With Act!’s Performance Navigator (by Performance Insights) ‘metrics that matter’, sales managers and leaders gain visibility, at a granular level, of what sales activities and behaviors are truly driving higher performance.
Act!’s New Performance Framework Identifies Whom to Move
Today’s sales managers and leaders can use Act!’s Performance Navigator (by Performance Insights) to Identify Centers of Excellence; top performers and top teams with Performance Navigator analytics (metrics that matter). Sales leaders can use these metrics to identify top performers and what they are doing that sets them apart – including identifying the specific activities and behaviors (best practices) driving each metric.
Sales managers and leaders are also able to use the ‘Metrics That Matter’ in Act!’s Performance Navigator (by Performance Insights) Coaching Scorecard & Team Dashboard to measure the metrics that matter in coaching and organize them in a well-designed set of reports, dashboards, and scorecards. You can see examples of these coaching reports, dashboards, and scorecards at www.actforfinancialservices.com.
Act!’s Performance Navigator (by Performance Insights) identifies your middle performers and gives you the insights to clone your top 20% performers – and move the entire organization ‘right and tight’ with Act!’s Performance Framework.
About the author
 Ron Buck is the Chairman & CEO of Performance Insights – an industry-leading software company serving the financial services industry. Ron is a recognized industry leader and has taken two companies public prior to Performance Insights.