
If you have a website, you want to know how people interact with it.
The most popular way to do this is by using Google Analytics. According to BuiltWith, over 28 million sites—including 74% of the most popular 10,000—were using the tool as of April 22, 2022.
It’s widely used for good reason. The software is simple to set up, accurate and provides a wide variety of website tracking features. It’s also completely free.
This means it is a great way for small business owners to see how people use their websites. In this article, we’ll show you how to use Google Analytics.
What is Google Analytics and Why Should You Use It?
Google Analytics is a website analytics platform. It provides site owners with useful information about their website and the people that use it.
This information includes how many people visit your site, how they access your site, and what they do when they land on it.
It also provides insight into who these visitors are. For example, where they are from, the language they speak, and demographic information such as their age range and gender.
The above information is useful for several reasons.
- Knowing how people visit your site shows you which marketing methods are most effective. This can help you deploy your marketing budget better. It also highlights where you need to make improvements.
- It can help tell you how effectively your pages are at converting visitors into customers.
- Knowing the pages people are visiting and how long they spend on the page shows you the content your visitors enjoy. Creating more similar content may attract more visitors.
- It tells you if you are attracting the right people to your site. A website for a U.K. based marketing company can take steps to improve the site if most of the visitors are from Canada, for example.
- Following long-term trends can provide insight into whether your strategies are working.
How to Use Google Analytics?
Google has made it very easy to get set up with Google Analytics. Here are the steps you need to take.
1. Sign up to Google Analytics
You need a Google account to sign into Analytics. Once you have an account, head over to the Google Analytics homepage and click “Set up for free.” When setting up Analytics, you need to choose an account name, select your data sharing settings, and then specify whether you want to measure a website, an app, or both.
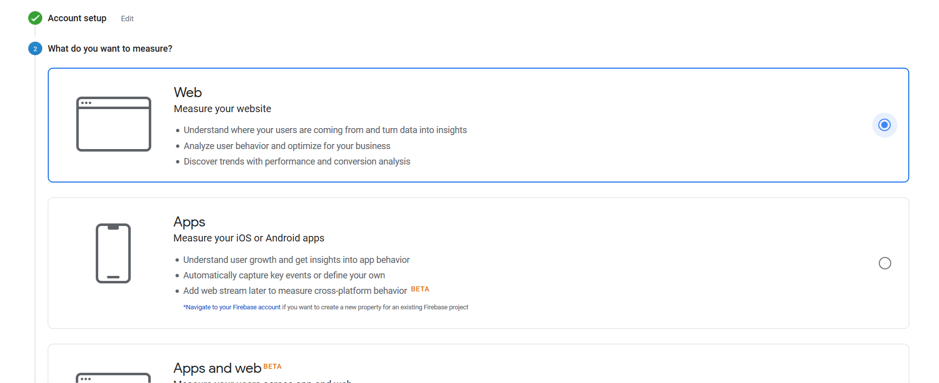
You should also input the website name, URL, and time zone.
2. Add the Google Analytics Tracking ID to Your Website
Once you have created your account, Google will provide you with a tracking ID. You need to add this ID to each of the pages on your site that you want to track.
While this can be complicated, most CMS systems and web builders make it easy to do.
If you use WordPress, you can use a free tool like Yoast to automatically add the tracking information. Meanwhile, Shopify, Squarespace, and Wix all have built-in integrations that make it easy to add code to a website.
3. Add Users to Google Analytics
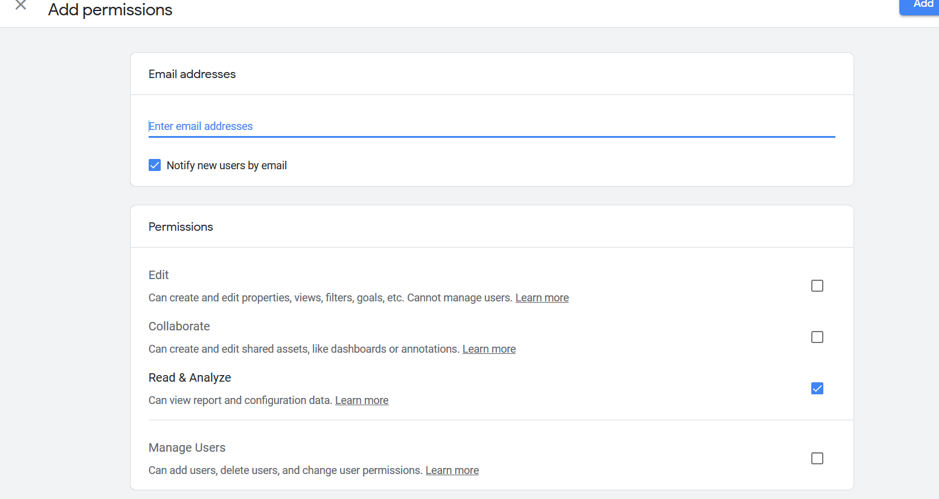
Once you have Google Analytics set up you can invite other people to access the account by heading to Adminà Account User Management and then clicking the plus sign.
When adding a user, you can choose the exact permissions you want to give them. You can also remove people from your Google Analytics account if you want to revoke access.
Google Analytics Reports
Now you are all set up, you can begin to take advantage of some of the reports that are available. Google provides several reports as default and you can also create custom reports using Google Analytics data via Google Data Studio.
You can find the reports in the menu bar on the left-hand side of the display.
Realtime
The real-time section lets you monitor visitor activity as it happens. You can see information such as where visitors are being referred to your website from, the pages people are currently viewing, and the countries people are located in.
If your website is new and you don’t have many visitors you may not get much use from this section. As your website grows, however, checking this section allows you to take action to optimize user experiences as it happens.
The real-time tab is useful for monitoring paid promotions as it shows how users are converting. If the conversion rate is low, you can take steps to optimize your campaign before it’s too late.
Another use of the real-time tab is to monitor popular pages. If you notice a particular page on your site is suddenly trending, you could take advantage of this by promoting it further on your homepage and social media channels.
Audience
The remaining reports are used to view historical trends. You can choose the date range you want to view by clicking on the calendar in the top right corner.
The audience section provides information about the people who have accessed your site. This includes the number of visitors, the percentage of returning users, and how many pages a person visits.
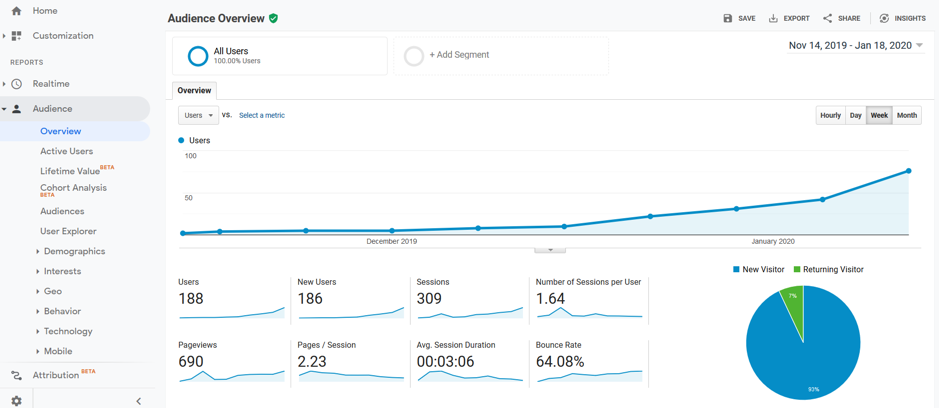
You can also see basic information about the users, such as where they are from, their language, and the operating system they use.
It’s possible to get more in-depth information including demographics and interests. You can gain access to this data by activating the section from within Google Analytics and changing your privacy policy so it reflects the extra information that you are collecting.
Acquisition
The acquisition section shows you how people are coming to your site. You can see which acquisition channels—search engines, social media, referrals or paid ads—are effective. You can also see how visitors acquired from different platforms act on your site.
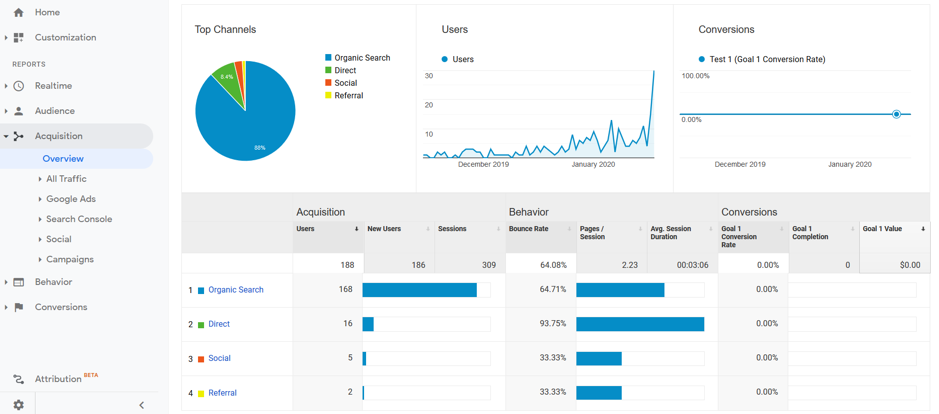
This is useful as it tells you if your marketing efforts in different areas are working. It can also help you spot opportunities for further growth.
If you are spending a lot of money on social but you notice that this channel has a low conversion rate (more on this below), you could think about redirecting your budget to acquisition channels that are converting at a higher rate.
Behavior
The behavior tab shows you how people act when they visit your site. It shows you which pages are most popular in the chosen time frame, as well as information about how long users spend on each page.
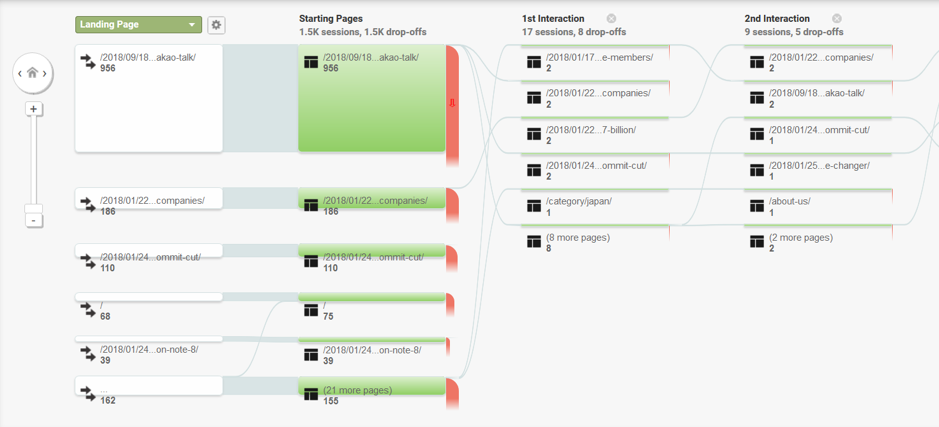
A particularly useful feature here is the behavior flow tool (above) which illustrates how users navigate your site. If you want people to take certain steps when they visit your site; for example, clicking from a blog post to an eBook signup form, this section will show you if your website is doing so effectively.
Conversions
The final tab is the conversions tab which lets you see how your website is performing in relation to specific goals.
You can set a variety of goals within Google Analytics. These include when users visit a specific page, when they spend a certain amount of time on your site, when they visit multiple pages, or when they perform an action.
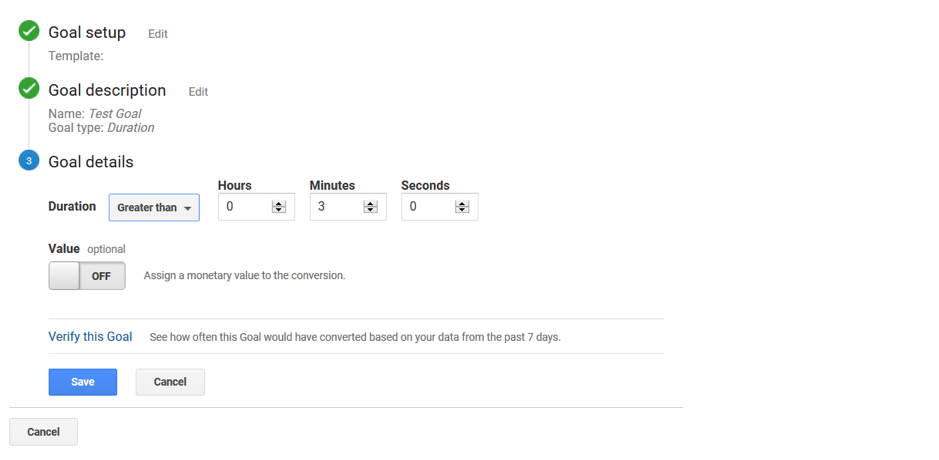
To set goals head to Adminà All Website Data à Goals à New Goal and then follow the instructions. Google Analytics will begin tracking conversions from the moment you click “Save goal.”
You can then track how many visitors reach these goals in the conversions tab. It is also possible to set and track multiple goals if you have a variety of offers on your site.
Your conversions will also show up in data in the other tabs. For example, in the acquisition tab you can see how well each type of traffic converts.
Wrapping Up
Google Analytics is a powerful free tool to help you analyze your website traffic and see how your site performs. It’s simple to use but has a ton of useful features should you want to go more in-depth.
Perhaps the best thing about the product is that it’s free, which means there really isn’t much stopping you from using Google Analytics on your site. Looking to grow your website traffic with high performing landing pages? Try Act! for free for 14 days.